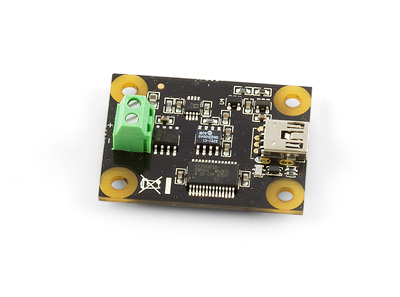
|
Notice: This page contains information for the legacy Phidget21 Library. Phidget21 is out of support. Bugfixes may be considered on a case by case basis. Phidget21 does not support VINT Phidgets, or new USB Phidgets released after 2020. We maintain a selection of legacy devices for sale that are supported in Phidget21. We recommend that new projects be developed against the Phidget22 Library.
|
Data Logging With a Thermocouple: Difference between revisions
No edit summary |
No edit summary |
||
| Line 1: | Line 1: | ||
<!-- CATEGORIES --> | <!-- CATEGORIES --> | ||
[[Category:fileIO]] | [[Category:fileIO]] | ||
The project described here is a | The project described here is a data recording program for the Phidget Temperature Sensors. We play with the program and record data to learn things about our environment. | ||
Revision as of 16:28, 11 April 2012
The project described here is a data recording program for the Phidget Temperature Sensors. We play with the program and record data to learn things about our environment.
Practical concepts covered are (click on links to see other projects on that topic):
|

|
As with any of our described projects, Phidgets takes care of the electrical component design. Here, we also provide some simple code so you can play around with your Temperature Sensor and thermocouple, and save the data to plot later.
Time: About two hours
Special Needed Tools: A Phidget Temperature Sensor (1048 or 1051), a Thermocouple, a USB cord, and your computer.
- You should have already worked through our Phidget Temperature Sensor Getting Started Guide for your Temperature Sensor - this will show you how to get the the Phidget Libraries installed for your operating system.
- Your computer should have one of:
- A a C compiler we support (including gcc, MinGW, Borland, Visual Studio, and many more)
- A version of Python 2.6 or later
- If you would like to follow along with the graphing examples, you can install the R Statistical package, which is free and available for Windows, Mac, and Linux.
