|
Notice: This page contains information for the legacy Phidget21 Library. Phidget21 is out of support. Bugfixes may be considered on a case by case basis. Phidget21 does not support VINT Phidgets, or new USB Phidgets released after 2020. We maintain a selection of legacy devices for sale that are supported in Phidget21. We recommend that new projects be developed against the Phidget22 Library.
|
Data Logging With a Thermocouple: Difference between revisions
| Line 119: | Line 119: | ||
The other languages will look almost exactly the same. Each period "." indicates a data point being written to the file. After you have recorded what you want to record, press 'Enter' and the file will be finalized and the program will exit. | The other languages will look almost exactly the same. Each period "." indicates a data point being written to the file. After you have recorded what you want to record, press 'Enter' and the file will be finalized and the program will exit. | ||
Most spreadsheet programs (Excel, Open Office) will automatically recognize a *.csv file as something they can open. You can use the spreadsheet program of your choice to open the *.csv file and look at the data you've recorded. Here, we use the program R to view and plot the data - it is [http://www.r-project.org/ free and | Most spreadsheet programs (Excel, Open Office) will automatically recognize a *.csv file as something they can open. You can use the spreadsheet program of your choice to open the *.csv file and look at the data you've recorded. Here, we use the program R to view and plot the data - it is [http://www.r-project.org/ free and available for many operating systems]. | ||
To import the data from the python program, we can start R on the command line with the command "R", and then import the {{Code|temperature_data_py.csv}} data file with: | To import the data from the python program, we can start R on the command line with the command "R", and then import the {{Code|temperature_data_py.csv}} data file with: | ||
Revision as of 17:27, 12 April 2012
The project described here is a data recording program for the Phidget Temperature Sensors. We play with the program and record data to learn things about our environment. The emphasis in this project is on passing data and writing to files in different languages, to also learn about data logging in general.
Practical concepts covered are (click on links to see other projects on that topic):
|
|
As with any of our described projects, Phidgets takes care of the electrical component design. Here, we also provide some simple code so you can play around with your Temperature Sensor and thermocouple, and save the data to plot later.
| Time: | About two hours for the basics, three hours for looking at and analysing the data |
| Special Needed Tools: | Something hot (tea, your skin), or something cold (ice, etc) |
| Materials and Phidgets: | A Phidget Temperature Sensor (1048 or 1051), a Thermocouple, a USB cord, and your computer |
Also:
- You should have already worked through our Phidget Temperature Sensor Getting Started Guide for your Temperature Sensor - this will show you how to get the the Phidget Libraries installed for your operating system.
- Your computer should have at least one of:
- A version of Python 2.6 or later, set up with the Python Phidget Libraries
- A version of Java, set up with the Java Phidget Libraries
- If you are using Linux (or the Phidget SBC), you can also use the gcc C compiler
- Set up the Phidget C libraries on Linux
- Set up gcc for development on the Phidget SBC
- If you would like to follow along with the graphing examples, you can install the R Statistical package, which is free and available for Windows, Mac, and Linux.
Introduction
This application guide is all about basic data logging and analysis with Phidgets. The ability to write an automatic data logger is one of the strong advantages to Phidgets - you do not have to take visual readings of a thermometer (or other sensor) and record the readings in a log book manually, rather, you can simply log directly to a computer.
Thermocouples provide a way to inexpensively measure the temperature of a material through physical contact. Although we use thermocouples and a Phidget Temperature Sensor (1048 or 1051) as our Phidget to log data from, basic data logging will be similar for many other Phidgets.
Phidgets
To use the code in this Guide, you will need to have a Phidget Temperature sensor and a thermocouple.
Some example ways to set this up are:
| Example Setup | Strengths |
|---|---|
| Basic thermocouple setup | |
| Ability to measure multiple points | |
| Wide temperature range thermocouple |
Of course, these are only examples - any thermocouple with either Temperature Sensor Phidget board will work.
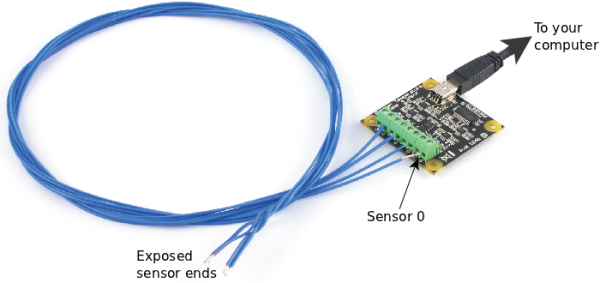
We will log data from thermocouple port 0. On a one-input board, this is the only thermocouple input; on a four-input board, make sure you have a thermocouple plugged in to port 0:
Then:
- Make sure you have followed the Getting Started guide for your Phidget
- Make sure you have the programming language libraries that you want installed
- Plug the USB in to your computer
- Continue on to the next section and start writing code!
Code
Java Code and Discussion
Python Code and Discussion
C Code and Discussion
If you are using Windows, please refer to the Java or Python section as the C code was written on Linux. The use of Phidgets in C on any operating system is the same. However, ANSI-based C does not include support for getting time on any resolution smaller than one second. So, to obtain timing for the data as it comes in, we need to use operating-system specific code. It would probably be fairly straightforward to modify this code to use a Windows method of obtaining time.
You will need to link in both the Phidgets library (-lphidget21) and the Real Time POSIX library (-lrt) when compiling your code:
Putting it All Together
The code above saves the data from the Temperature Sensor Phidget into a Comma Separated Value file (*.csv). It will be named based on the code snippet you use and written into the directory where you run the code:
- Java code writes to "temperature_data_java.csv"
- Python code writes to "temperature_data_py.csv"
- C code writes to "temperature_data.csv"
Try running the code on a command line or in a terminal. For example, if you are using the Python code and have saved it to a file code.py, running it will give you something like this:

The other languages will look almost exactly the same. Each period "." indicates a data point being written to the file. After you have recorded what you want to record, press 'Enter' and the file will be finalized and the program will exit.
Most spreadsheet programs (Excel, Open Office) will automatically recognize a *.csv file as something they can open. You can use the spreadsheet program of your choice to open the *.csv file and look at the data you've recorded. Here, we use the program R to view and plot the data - it is free and available for many operating systems.
To import the data from the python program, we can start R on the command line with the command "R", and then import the temperature_data_py.csv data file with:
temp.data = read.csv("temperature_data_py.csv")
This import will automatically carry over the headers from the text file. Unlike other languages, the dot "." in R can simply be used as part of a variable name. The "accessor" function for accessing the slots within an object is the dollar sign "$". To plot the temperature data, you simply type:
plot(temp.data$Time,temp.data$Thermocouple.Temperature)
Or we can pretty it up with axis labels, lines instead of dots, and some colour with:
plot(temp.data$Time,temp.data$Thermocouple.Temperature,type="l",ylim=c(0,70),xlab="Seconds",ylab="Degrees Celsius",col="blue")
Which gives:
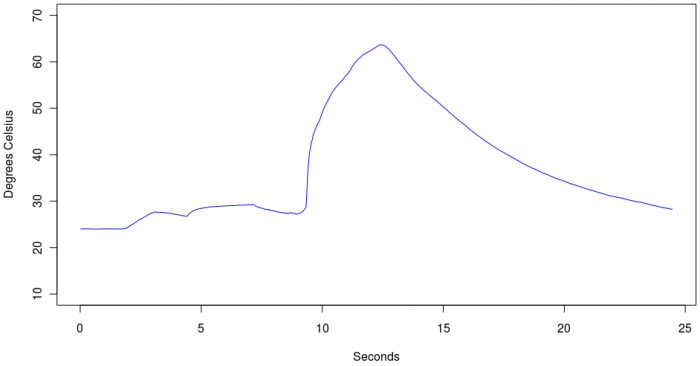
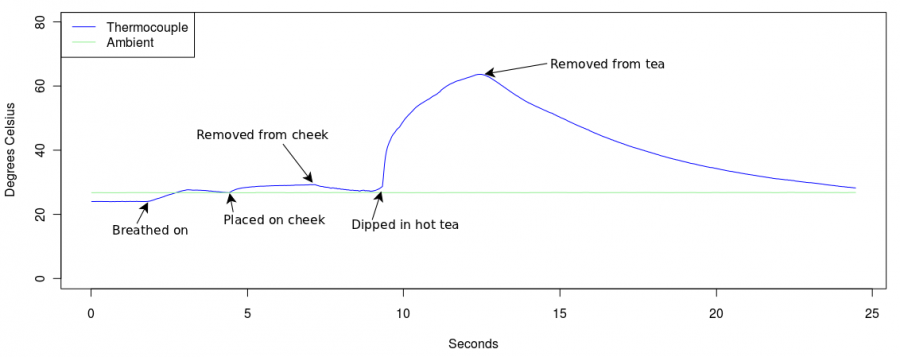
This temperature variation was obtained by touching the sensor to warm materials, and this is a good test to make sure your leads are hooked up correctly. The large spike in temperature is due to the thermocouple being immersed into hot tea. But if the leads were backwards, as we did with a second recorded series of the same materials, it will look something like this:
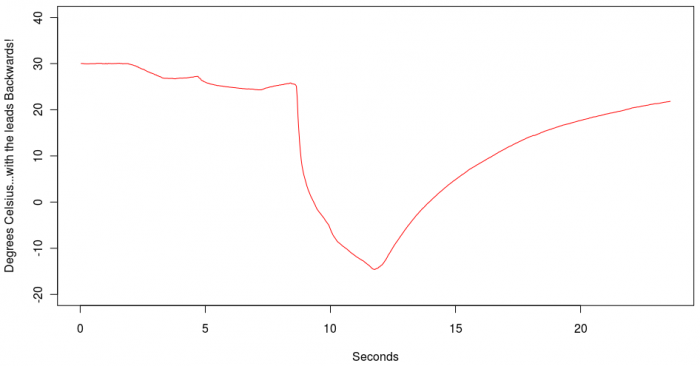
Since hot tea is not colder than -10C, this is a good indication that the leads are reversed. However, the ambient temperature at the start of the series is possible but not unreasonable, so accidentally reversing the leads may only be discovered when objects of very different temperatures are measured.
Data Analysis
Extra Credit
- As mentioned above, the thermocouple is a contact temperature sensor - it works by becoming the same temperature as the material it is touching. There were a few materials
